System Information Bar
What is this?
Scientia potentia est
Knowledge is power. Knowing before hand or previewsly the system colapses or run out of resources, it becomes a priority, due to this, and to contemplate the panorama of programs that show us the resources and performance of our systems, SI arrives with a super powerful, fabulous and extremely concise bar of information of the actual resources.
Tools with more detail:
-
Terminal:
- sysstat - Performance monitoring tools for Linux
- top - Dynamic real-time view of running processes
- htop - Interactive process viewer for Unix
- conky-cli - Light-weight system monitor for terminal
- glances - An Eye on your system. A top/htop alternative
-
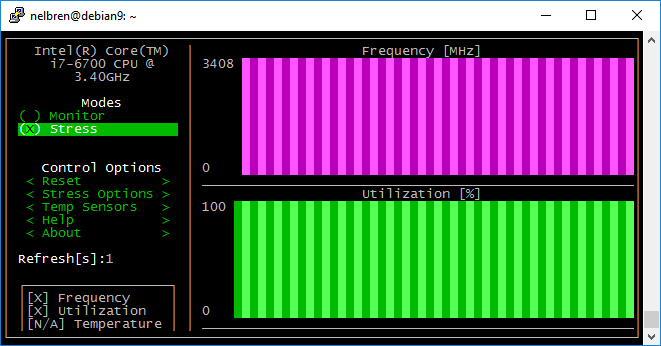
- pip install s-tui; apt install stress; s-tui

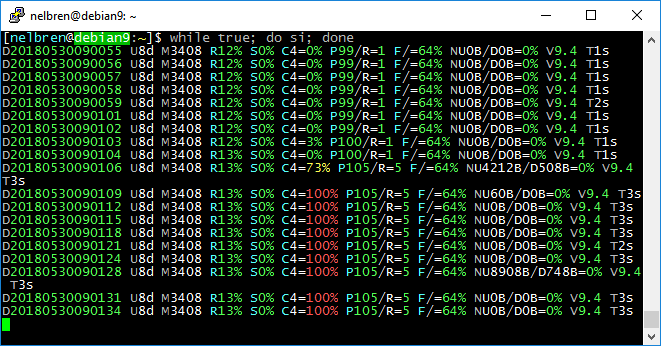
- while true; do si; done

- pip install s-tui; apt install stress; s-tui
-
Web:
How does it work?
It is a sequence of commands from bash which extracts the information utilizing the tools from the system or the files of the process, according to the thresholds it assigns the color, and shows everything in a single line in less than 80 characters.
Information shown:

How do i obtain it?
- Through github:
cd /usr/local/
git clone https://github.com/nelbren/npres.git
How do i use it?
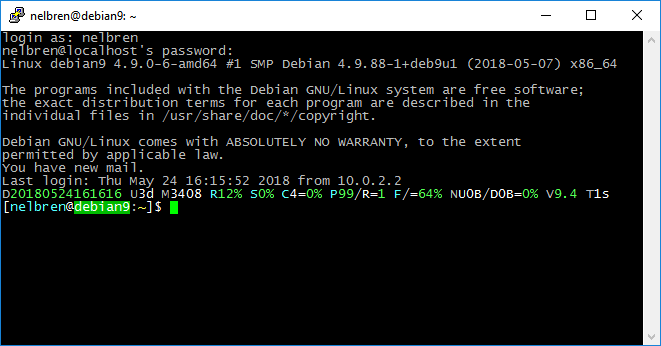
- When logging in, add to the file /etc/profile:
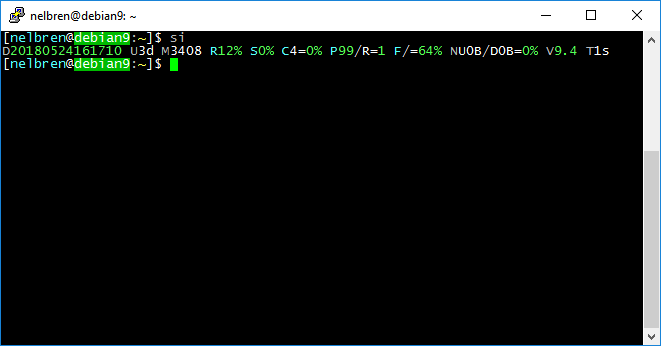
. /usr/local/npres/bin/alias/set.bash - By demand:
si
Examples:
-
When logging in: Example of command execution:

-
By demand: Example of command execution:

Thanks to:
- Paul Colby by the code of Calculating CPU Usage from /proc/stat
- Nelbren by the code of si
 System Information Bar


